- How to understand data and how to drive insights from the data?
- How to ensure that you are ready to use machine learning algorithms in a project?
Well, Exploratory Data Analysis(EDA) in Python helps to answer all these questions. To understand the data first and then try to gather as many insights from it. EDA is performed to define and refine the selection of variables that are important for our problem which can be used for machine learning.
In this post, we will perform Exploratory Data Analysis of the FIFA 19 dataset which is available in Kaggle.
Let’s get started!
1. Importing Libraries
To start exploring your data, you will need to start by importing the data in your jupyter notebook. You can use pandas following the convention pd and by using read_csv() function. We are using other libraries i.e. numpy, seaborn and matplotlib.
import pandas as pd
import numpy as np
import matplotlib.pyplot as plt
import seaborn as sns
import warnings
warnings.filterwarnings("ignore")
2. Loading the dataset
fifa_data= pd.read_csv("data.csv")
fifa_data.head()

fifa_data.shape

fifa_data.columns
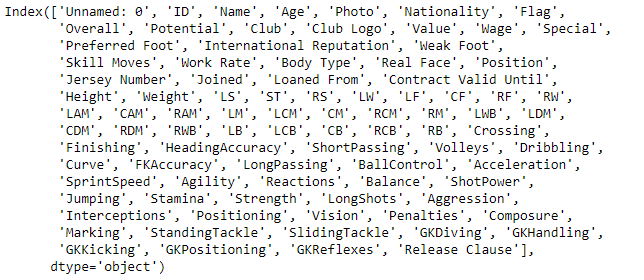
fifa_data.info()

There are 18207 rows in the dataset. As we have seen that there are many variables with less rows as well.
fifa_data.describe()

•From the above data, we can conclude that Age of players varies from 16 to 45.
•There is huge difference between the 75% and max values of predictors “GKDiving”, “GKHandling”, “GKKicking”, “GKPositioning” and “GKReflexes”.
•Above two observations, gives an indication that there are extreme values-deviations in our dataset.
Data Cleaning
Now, we will remove unnecessary columns and will change two columns “Value” and “Wage” for analysis.
fifa_data.drop(columns=["Unnamed: 0"],inplace=True)# function to change values
def currencystroint(amount):
    new_amount=[]
    for s in amount:
        list(s)
        abbr= s[-1]
        if abbr is 'M':
            s=s[1:-1]
            s=float(''.join(s))
            s*=1000000
        elif abbr is 'K':
            s=s[1:-1]
            s=float(''.join(s))
            s=s*1000
        else:
            s=0
        new_amount.append(s)
    return new_amountfifa_data["Value"]= currencystroint(list(fifa_data["Value"]))
fifa_data["Wage"]= currencystroint(list(fifa_data["Wage"]))
# Selecting only required columns for analysisfifa_data1=fifa_data[["ID","Name","Age","Overall","Potential","Value", "International Reputation", "Height", "Weight", "Position","Wage","Club","Nationality"]]
fifa_data1.head()

EDA:
fifa_data1.isna().sum()
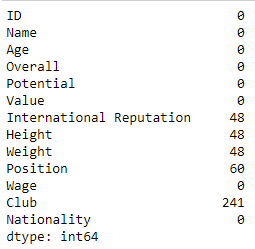
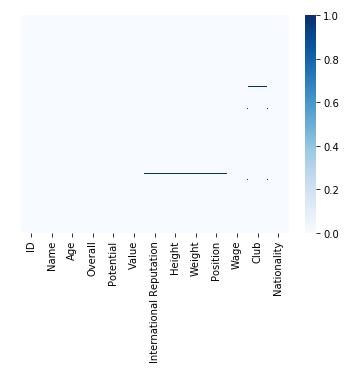
- There are missing values in the variables “International Reputation”, “Height”, “Weight”, “Position” and “Club”.
sns.heatmap(fifa_data1.isnull(),cbar=True,yticklabels=False, cmap="Blues")
fifa_data1.dtypes
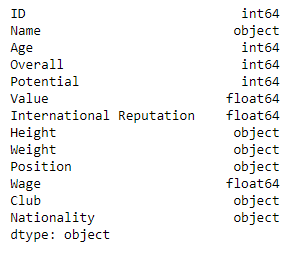
- There are variables with “object”, “float” and “int” datatype.
import warnings
warnings.filterwarnings("ignore")
fifa_data1["International Reputation"].fillna(1, inplace=True)
fifa_data1["Height"].fillna("5'11", inplace=True)
fifa_data1["Weight"].fillna("200lbs", inplace=True)
fifa_data1["Position"].fillna("ST", inplace=True)
fifa_data1["Club"].fillna("No CLub", inplace=True)fifa_data1.isnull().sum()
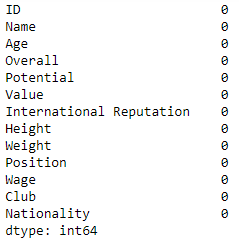
import missingno as msno
msno.matrix(fifa_data1)
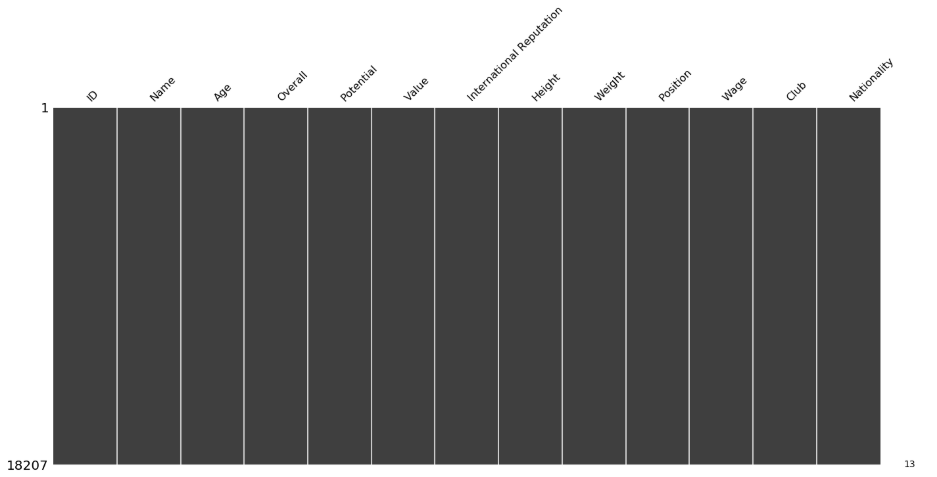
- From the above visualization, we can see that now there is no missing value.
plt.figure(figsize=(8,4))
sns.heatmap(fifa_data1.corr(),cmap="BuPu",annot=True)
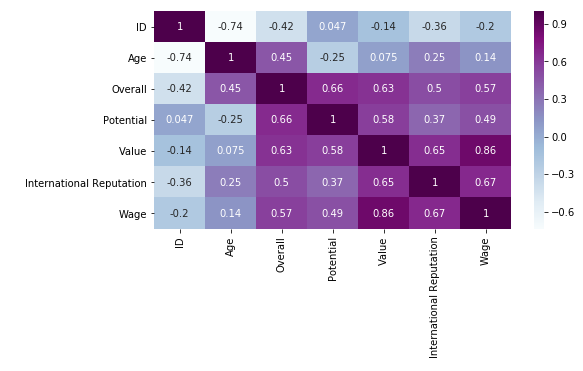
- From the correlation, we can see that variables “Value” and “Wage” are highly correlated.
Which countries have the most players?
fifa_data1["Nationality"].value_counts()
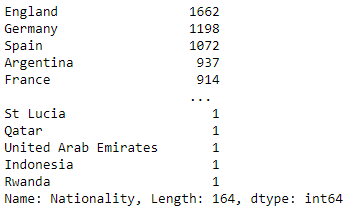
- England has the most players.
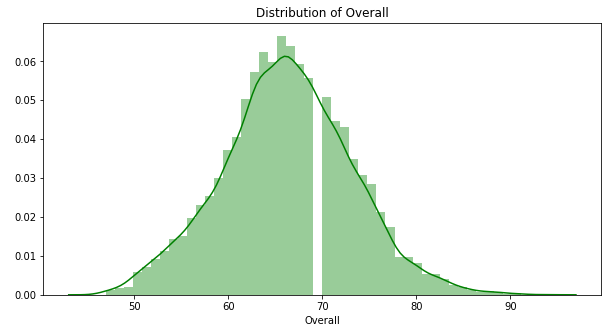
Distribution of Overall Rating
plt.figure(figsize=(10,5))
plt.title("Distribution of Overall")
a= sns.distplot(fifa_data1["Overall"],color="g")
import warnings
warnings.filterwarnings("ignore")
plt.rcParams["figure.figsize"]=(15,5)
sns.distplot(fifa_data1["Wage"],color="blue")
plt.xlabel("Wage Range for Players",fontsize=12)
plt.ylabel("Count of the Players", fontsize=12)
plt.title("Distribution of Wages of Players",fontsize=18)
plt.xticks(rotation=90)
plt.show()
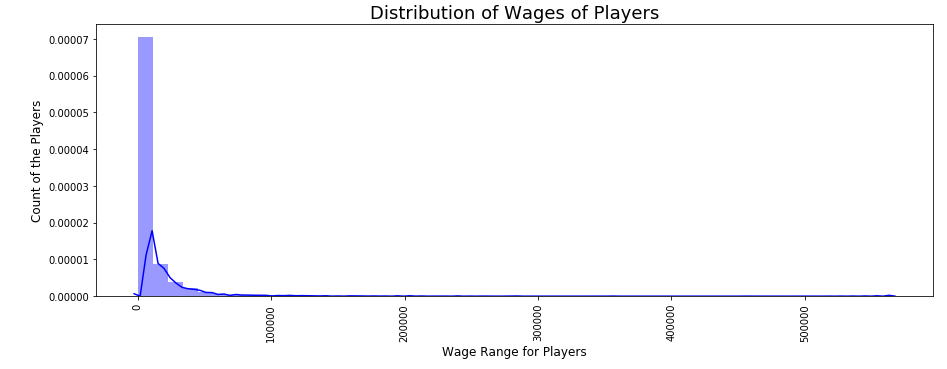
- We can see that all players are getting wages under 800000.
plt.figure(figsize=(13,8))
ax=sns.countplot(x="Height", data=fifa_data1,palette="dark")
ax.set_title(label="Count of Players on Basis of Height",fontsize=18)
ax.set_xlabel(xlabel="Height in Foot per inch",fontsize=18)
ax.set_ylabel(ylabel="Count", fontsize=18)
plt.show()
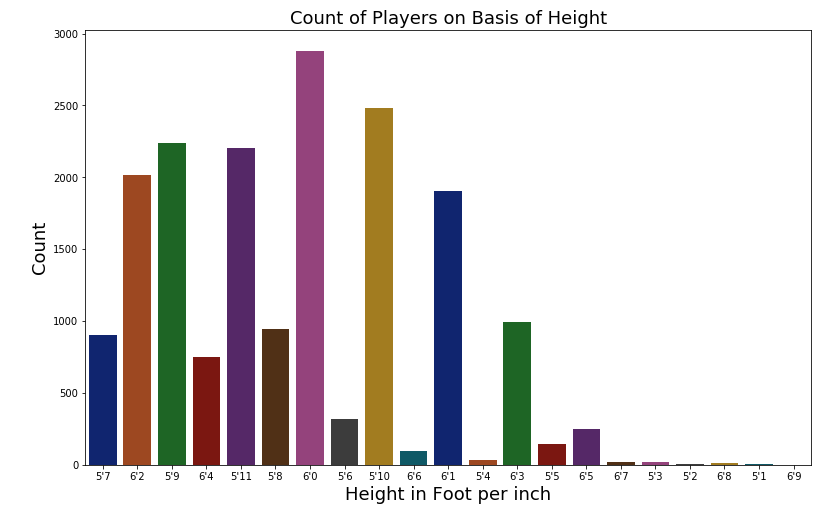
•Most of the players have 6’0 Height.
Finding 10 youngest players
youngest_players= fifa_data1.sort_values("Age",ascending=True)[["Name","Age","Club","Nationality"]].head(10)
print(youngest_players)

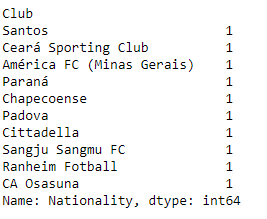
Which are the Top 6 clubs with different Countries?
fifa_data1.groupby(fifa_data1["Club"])["Nationality"].nunique().sort_values(ascending=True).head(10)
Which age group players are expensive?
mean_age= fifa_data1.groupby("Age")["Value"].mean()
a=sns.barplot(x=mean_age.index,y=mean_age.values)
a=plt.xticks(rotation=90)
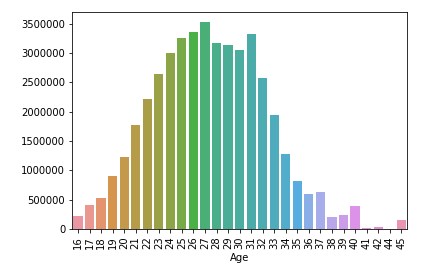
- Players are most expensive between age 24–31.
In this tutorial, you have learned how to dive deep in the dataset and analyse variables, Exploratory Data Analysis using pandas and visualization of dataset using matplotlib and seaborn.


