The clustering algorithm identifies the identical data points in a group of multiple datasets and arranges them in a cluster to apply similar functionality. Also, we can claim that the clustering algorithm divides the population of multiple similar data points in a group of multiple datasets with similar characteristics. There are several clustering algorithms some of them are listed below.
- Hierarchical Clustering Algorithm
Hierarchical Clustering Algorithm is an unsupervised machine learning algorithm. It focuses on natural grouping based on the characteristics of the data.
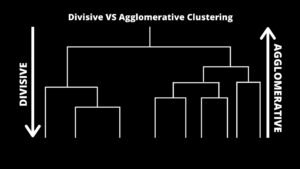
The hierarchical clustering algorithm is designed to find nested groups of the data by creating the hierarchy. It’s similar to the biological taxonomy of a plant or animal kingdom. Hierarchical clusters are usually represented using the hierarchical tree known as a dendrogram.
Further, the hierarchical clustering algorithm is sub-divided into two categories 🙂
1. Divisive clustering
DIANA (DIvisive ANAlysis). This is a type of hierarchical clustering where it works on the principle of a top-down approach in which the algorithm begins by developing a big cluster and it recursively divides probably the most dissimilar cluster into 2 and it moves on until we are all of the similar information factors are supposed to be within their respective clusters. These divisive algorithms lead to highly accurate hierarchies compared to the agglomerative approach though they are computationally expensive.
2. Agglomerative clustering
In this type of hierarchical clustering, the hierarchical decomposition works on the principle of a bottom-up approach, in which the algorithm begins to develop an atomic cluster or a small cluster by adding one data type at a time and later merge them together to form a big cluster at the end, where this cluster full-fills all the termination conditions. This process is repeated until all the data points are collected under a single cluster.
AGNES (AGglomerative NESting) is a part of agglomerative clustering that combines the data points into a cluster based on the similarity. The result of the algorithm is a tree-based structure called Dendrogram. Then distance metrics are used to decide which data point should be combined with which cluster. It constructs a distance matrix and checks the smallest distance between a pair of clusters and combines them. We have 3 different categories based on how the distance between each cluster is measured:
- Single linkage – In this, the shortest distance between the two data points in each cluster is defined as the distance between the clusters.
- Complete linkage – In this, we consider the longest distance between the data points in each cluster is defined as the distance between the clusters.
- Average Linkage – In this, we consider the average between each data point in a cluster to every other data point in the other clusters.
- K means clustering
K means clustering is a type of unsupervised learning algorithm. When the data is unlabeled it is used if the data is not defined\labeled in groups or categories. K means clustering algorithm aims to search and find the groups in the input data, where K is used to represent the number of groups.
K means clustering is an iterative algorithm that partitions the dataset based on their features to K number of predefined non-overlapping distinct clusters or subgroups. It is the data points for inter clusters as similar as possible and also attempts to help the clusters as far as it possibly can.
It allocates the data points to a cluster in case the sum of the squared distance involving the cluster’s centroid and also the data points are at a minimum where the cluster’s centroid is the arithmetic mean of the data points that are in the cluster. A less variation in the cluster leads to homogeneous or similar data points in the cluster.
Working of K means Clustering Algorithm
Given,
K = number of clusters or subgroups.
Input or training data = {x1, x2, x3, ………….. xn}
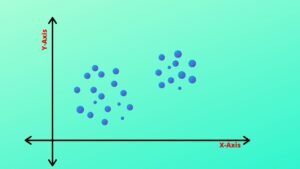
For example:
In the given graph above, let us assume we have input data i.e. unlabeled and we need to divide this into clusters.
First, we need to find the number of clusters, this can be done by either of the two ways:
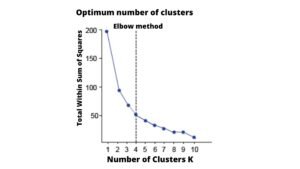
1. Elbow method
A curve is drawn between “within the sum of squares” and the total number of clusters. The plotted curve resembles a human arm. It is known as the Elbow method because the maximum number of clusters is obtained from the point of elbow in the curve. After the elbow point, the value of WSS changes gradually so elbow point must be considered to give the final output i.e. the total number of clusters.
2. Purpose-based method
The data points are divided on the different metrics and then it is judged how well it is performing for that case. For example, the arrangement of the Jeans in the men’s clothing department in a mall is done on the criteria of the sizes or it can be categorized on the basis of price or brands, etc. The best suitable case will be considered to give the maximum number of clusters, hence the value of K is determined.
Note: Hence the value of K i.e. the total number of clusters can be calculated using any of the above two methods.
- Mean-Shift Clustering
Mean shift clustering is a sliding-window-based algorithm that tries to discover dense areas of data points. It’s a centroid-based algorithm meaning that the objective is to find the center points of every group/class, which functions by updating candidates for center points to be the mean of the areas in the sliding window. These applicants are then filtered in a post-processing phase to eliminate near-duplicates, developing the last set of center points and their corresponding groups.
For example:
Imagine a football field with 100 people standing on it. Now due to the fog, people can only see a short distance. Every minute each person looks around and takes a step in the direction of most people they can see. With time people start making groups as they repeatedly take steps towards each other, the final result is a cluster of people is formed on the football ground.
- DBSCAN or Density-based clustering
All clustering methods follow the same approach i.e. the first step is we calculate similarities and then we cluster all the data points into groups\batches. Now, we will discuss the Density-based spatial clustering of applications with noise (DBSCAN) clustering method.
DBSCAN is a density-based clustering algorithm and it is similar to Mean-Shift but with a few more notable advantages. It is based on the intuitive notion of “clusters” and “noise”. Partitioning methods K-means, hierarchical clustering, and PAM clustering are used to find convex clusters or spherical-shaped clusters or they are suitable for only compact and well-separated clusters. If we consider real-life data, it may contain irregularities like:
- Clusters can be of arbitrary shape.
- Data may contain noise.
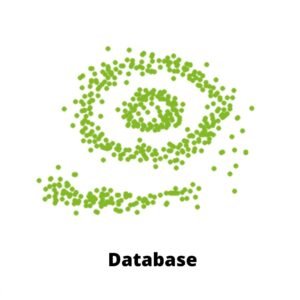
The figure above shows a data set within non-convex clusters and noises/outliers. In the given data set, K means algorithm has difficulties for identifying clusters with arbitrary shapes.
This algorithm requires two parameters:
- eps
It is used to define the neighborhood around a data point i.e. if the distance between two data points is lower or equal to ‘eps’ then the data points are considered as neighbors. If the value of eps is too small then a large part of the data set will be considered as outliers. If the value is chosen very large then the clusters will merge and the majority of the data points will be in the same clusters. To find the value of eps we can use K-distance graph
- MinPts
A minimum number of neighbors (data points) within the eps radius. If the dataset is larger, the value of MinPts should be larger. The minimum MinPts can be derived from the number of dimensions D i.e. MinPts >= D+1. The minimum value of MinPts must be 3.
In this algorithm, there are 3 types of data points
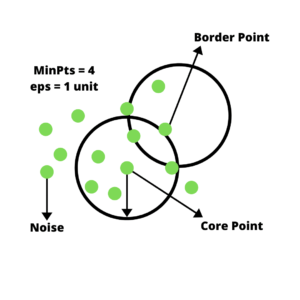
- Core point – A point is considered as a core point if it has more points than MinPts within eps.
- Border point – A point having fever points than MinPts within eps and it is in the neighborhood of a core point.
- Outliner\Noise – Any point that is not a core or border point is known as Noise\outliner.


